Technical analysis is built on the principle that market prices reflect all available information and that price movements tend to follow identifiable patterns. Rather than relying solely on financial statements or economic data, technical analysts study historical price action, trading volume, and market behaviour to identify trends and potential trading opportunities.
While no technical indicator can predict the market with absolute certainty, combining multiple tools enables traders to improve their decision-making, manage risk more effectively, and identify higher-probability trade setups.
Below are some of the most widely used technical analysis tools employed by traders across equities, foreign exchange, commodities, cryptocurrencies, and fixed-income markets.
1. Candlestick Charts:
Candlestick charts are among the most widely used tools in technical analysis. They are simple to identify, easy to understand, and can provide highly profitable trading opportunities. Extensive research has shown that many candlestick patterns possess strong predictive value, helping traders anticipate potential market movements with greater confidence.
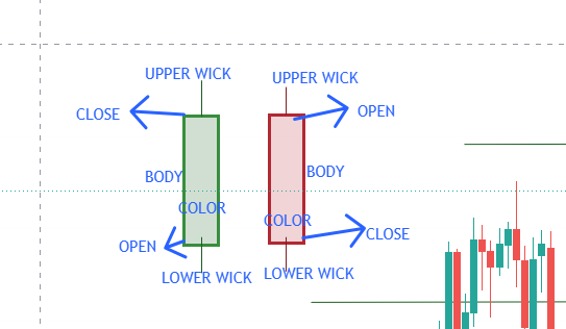
A candlestick is a graphical representation of an asset’s price movement over a specific period. Each candlestick displays four key price points: the opening, highest, lowest, and closing price. By analysing candlestick charts across different timeframes, traders can quickly interpret market sentiment, identify emerging trends, and make more informed trading decisions.
Each candlestick consists of three key features that help traders understand price movement:
- Body: Represents the difference between the opening and closing prices.
- Wick (Shadow): Shows the highest and lowest prices reached during the trading period.
- Colour: Indicates the market direction. Green (or white) candles represent bullish (increase) price movement, while red (or black) candles indicate a bearish (decrease) price movement.
Candlestick patterns;
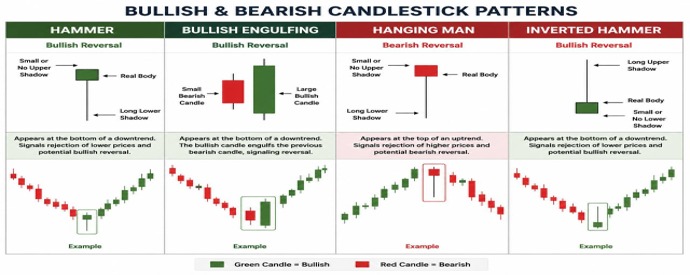
Bullish Candlestick Patterns typically appear after a downtrend and may signal a potential reversal to an upward trend. They indicate increasing buying pressure and may present traders with an opportunity to open long (buy) positions in anticipation of rising prices.
Common bullish patterns include:
- Hammer
- Bullish Engulfing
- Morning Star
- Piercing Line
- Three White Soldiers
- Inverted Hammer
Bearish Candlestick Patterns generally form after an uptrend and signal a potential reversal to a downward trend. They indicate that selling pressure is increasing and buyers are losing control. As a result, traders may choose to close their long (buy) positions and open short (sell) positions to benefit from a potential decline in price.
Common bearish patterns include:
- Hanging Man
- Bearish Engulfing
- Evening Star
- Dark Cloud Cover
- Three Black Crows
- Shooting Star
Other important candlestick formations include the Doji, Spinning Top, Harami, and Marubozu etc
Candlestick analysis becomes significantly more reliable when combined with other technical tools such as support and resistance levels, trend lines, volume analysis, and technical indicators.
2. Support and Resistance Levels
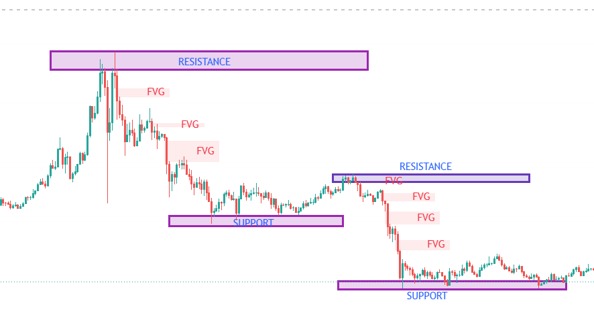
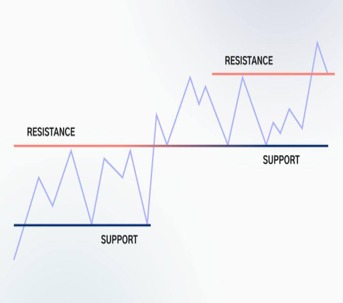
Support and resistance are among the foundational concepts of technical analysis. They represent key price levels where buying and selling pressure temporarily reach a balance, often causing the market to pause, reverse, or consolidate direction.
Support (Demand) is the price level where buying interest is strong enough to prevent the price from falling further.
Resistance (Supply) is a price level where selling pressure becomes strong enough to prevent the price from rising further.
These levels are formed when the market repeatedly reverses at certain prices. As a result, price often respects these areas by bouncing off them multiple times. However, if buying or selling pressure becomes strong enough, the price can break through a support or resistance level, often leading to the start of a new trend.
Understanding support and resistance helps traders identify potential entry and exit points, set stop-loss orders more effectively, and anticipate possible market reversals or breakouts.