3. Trend Lines
Trend lines are one of the most important tools in technical analysis. They are straight lines drawn by connecting two or more significant price points to identify the direction of the market. Trend lines help traders recognize the prevailing trend and anticipate the next impulsive price movement.
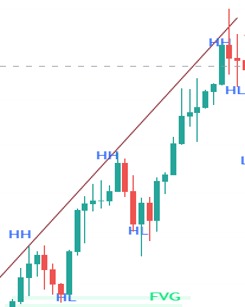
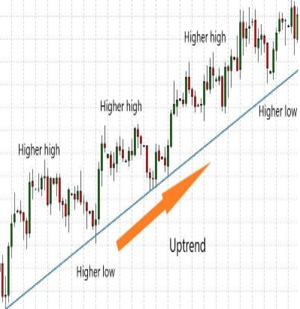
An uptrend line is drawn by connecting a series of higher lows and serves as dynamic support, showing sustained buying remains in control. As long as the price continues to respect the trend line, the market is likely to continue moving upward.
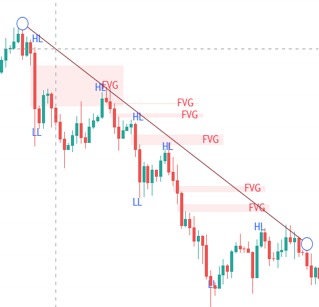
A downtrend line connects successive lower highs and acts as dynamic resistance, reflecting continued selling pressure. Should the price remain below the trend line, the market is likely to continue moving downward.
How Trend Lines Help Traders;
- Identify the current market trend (uptrend, downtrend, or sideways).
- Anticipate the next impulsive move in the direction of the trend.
- Identify potential entry and exit points.
- Locate dynamic support and resistance levels.
- Detect possible trend reversals when the price breaks the trend line with strong momentum.
4. Moving Average (MA)
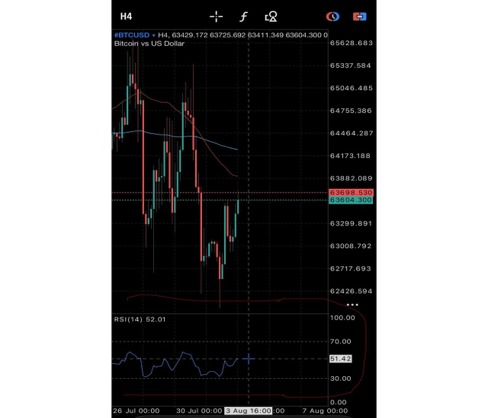
The MA is one of the most popular technical indicators used by traders to identify the direction of a market trend. It works by calculating the average price of an asset over a specific number of periods, smoothing out short-term price fluctuations and making the overall trend easier to recognize.
Types of Moving Averages:
- Simple Moving Average (SMA): Calculates the average closing price over a selected number of periods, giving equal weight to every price.
- Exponential Moving Average (EMA): Gives more weight to recent prices, making it more responsive to current market movements than the SMA.
The EMA closely follows the price movement, responding quickly to changes in market direction. This makes it particularly useful for identifying trend changes earlier than the Simple Moving Average, although it can also produce more false signals in highly volatile or sideways markets.
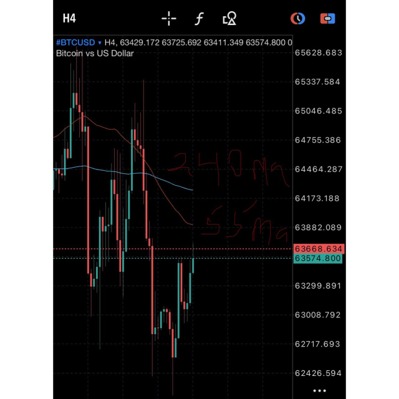
Commonly used moving average settings for short, medium and long-term trade are: 50/55 MA, 100MA, 200MA and 240MA
5. The Relative Strength Index (RSI)
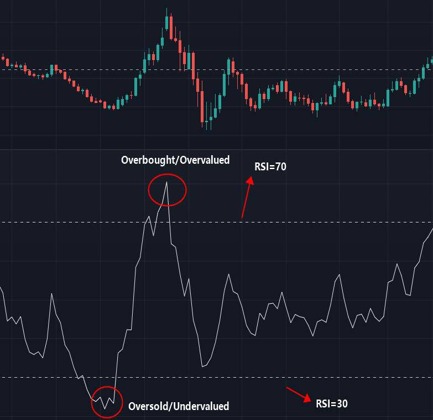
The RSI is a momentum oscillator used in technical analysis to measure the speed and strength of an asset’s recent price movements. Developed by J. Welles Wilder Jr., the RSI helps traders determine whether an asset is overbought or oversold, which may indicate a potential price reversal.
The RSI is displayed as a line that moves between 0 and 100.
- RSI above 70: The asset is considered overbought, suggesting buying pressure may be weakening, and a price pullback or reversal could occur.
- RSI below 30: The asset is considered oversold, suggesting selling pressure may be weakening, and a price rebound or reversal could occur.
- RSI between 30 and 70: The market is generally considered to be in a neutral zone, with no strong overbought or oversold conditions.
How Traders Use RSI
- Identify potential buying opportunities when the RSI rises from below 30.
- Identify potential selling opportunities when the RSI falls from above 70.
- Confirm the strength of an existing trend.
- Spot bullish and bearish divergences, where the RSI moves differently from the price, potentially signalling a trend reversal.
6. Moving Average Convergence Divergence (MACD)
The MACD is a popular momentum and trend-following indicator that helps traders identify the strength, direction, and potential reversal of a market trend. It is based on the relationship between two Exponential Moving Averages (EMAs).
Components of the MACD;
- MACD Line: Measures the difference between the 12-period EMA and the 26-period EMA.
- Signal Line: A 9-period EMA of the MACD line used to generate buy and sell signals.
- Histogram: Displays the distance between the MACD line and the Signal line, helping traders measure the strength of market momentum.
How Traders Use MACD;
- Bullish Signal: When the MACD line crosses above the Signal line, it indicates increasing buying momentum and may present a buying opportunity.
- Bearish Signal: When the MACD line crosses below the Signal line, it indicates increasing selling momentum and may present a selling opportunity.
- Trend Confirmation: If the MACD is above the zero line, the market is generally bullish. If it is below the zero line, the market is generally bearish.
- Momentum Strength: A growing histogram indicates strengthening momentum, while a shrinking histogram suggests weakening momentum.