Why Cryptocurrency Markets Are Not Perfectly Efficient
This is where the subject becomes particularly valuable for crypto investors. The cryptocurrency market is not one uniform market. Bitcoin, Ethereum, established altcoins, and newly launched meme coins can behave very differently. Several factors can create opportunities for temporary price inefficiencies.
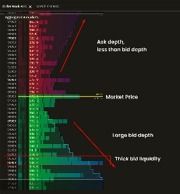
- Liquidity differences: Bitcoin typically attracts far more trading activity than an obscure token. In a low-liquidity market, even a relatively small buy or sell order can move the price significantly.
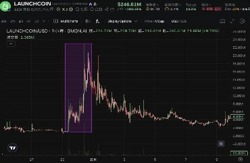
Unique insight: A token rising 50% does not necessarily mean demand is exceptionally strong. It may simply mean there are few sellers and insufficient liquidity to absorb orders.
- Unequal access to information: Some investors monitor on-chain transactions, developer activity, token unlock schedules, governance decisions, and exchange order books before such information attracts widespread attention.
Unique insight: An information advantage is useful only if it helps you understand something the market has not already priced in. Seeing a large wallet transfer is not proof that a whale intends to sell.
- Human Psychology and Hype: Fear of missing out (FOMO), panic selling, greed, and herd behaviour can cause prices to move beyond what available evidence may justify.
Unique insight: A token can be overvalued and continue rising because demand keeps increasing. Being correct about its valuation does not mean you can correctly predict when the price will reverse.
- Fragmented Markets and Trading Costs: A token may trade at different prices across centralized exchanges and decentralized exchanges because liquidity, fees, network congestion, and execution conditions differ.
Unique insight: A visible price difference is not automatically a profitable arbitrage opportunity. The difference may disappear before execution or be consumed by fees, slippage, and transfer costs.
The lesson is not that the market is always inefficient. It is that inefficiency can depend on the asset, the period, the trading venue, liquidity, and the information available.
The Relationship Between EMH And Technical Analysis
This is an important distinction for anyone studying candlestick patterns, support and resistance, RSI, MACD, Fibonacci levels, volume, and market structure.
If historical price information is already reflected in current prices, why do traders still use technical analysis?
Because technical analysis can serve two different purposes:
- Prediction: Attempting to forecast future prices and generate excess returns.
- Decision-making: Identifying entry conditions, defining invalidation levels, managing risk, and planning exits.
The second purpose can be useful even when the first is unreliable.
Consider this hypothetical Bitcoin scenario:
Example: A support-level trade
Entry price: $100,000
Stop-loss: $98,000
Target price: $105,000
Risk-to-reward: 1:2
The trader risks $2,000 per BTC to target a potential $5,000 gain per BTC, before fees, slippage, and funding costs.
This is an illustrative setup, not a current Bitcoin trade recommendation.
The support level does not guarantee a rebound. The market may already have priced in the historical pattern, or a new event may cause the level to fail.
However, the setup gives the trader predefined risk and reward parameters. The deeper lesson: You do not have to predict every price movement correctly to trade systematically. You need a strategy whose results remain favourable after losses, costs, and changing market conditions are accounted for.
EMH and Smart Money: Can Whales Be Wrong?
Crypto investors often follow large wallets, institutional flows, exchange inflows, exchange outflows, and the activities of experienced traders.
These can provide useful information, but they should not be confused with certainty.
Imagine a wallet transfers 10 million tokens to a centralized exchange. Three interpretations are possible:
- The holder intends to sell.
- The holder is moving assets for custody or collateral purposes.
- The holder is reorganizing funds or preparing another transaction.
The transfer alone does not establish which interpretation is correct.
Similarly, a large withdrawal from an exchange may indicate a movement to self-custody, but it does not automatically prove that the holder intends to hold long-term.
This creates an important distinction: On-chain data tells you what happened on the blockchain. It does not always tell you why it happened or what will happen next.
The market may already have anticipated the transaction, or other participants may interpret it differently.
A stronger approach is to combine on-chain data with liquidity, price action, wallet history, tokenomics, and the broader market environment.