7. Bollinger Bands:
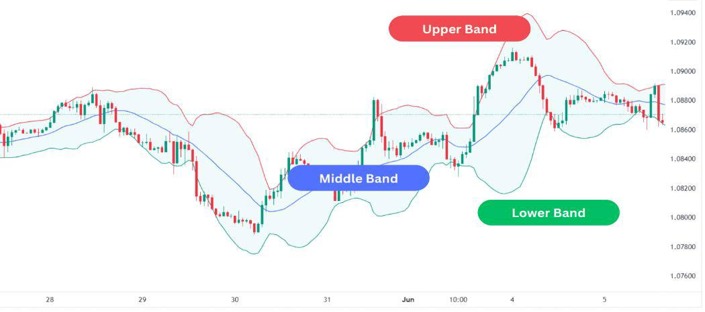
The Bollinger Bands are a volatility indicator developed by John Bollinger. They help traders measure market volatility, identify overbought and oversold conditions, and spot potential trend reversals or breakouts.
The indicator consists of three lines: Upper band, Middle band, and Lower band
Key Points;
- Bollinger Bands measure market volatility, not trend direction.
- They help traders identify potential buying and selling opportunities, as well as possible breakouts.
- Bollinger Bands are most effective when combined with RSI, MACD, Moving Averages, Support and Resistance, and Candlestick Patterns for stronger trade confirmation.
8. Fibonacci Retracement
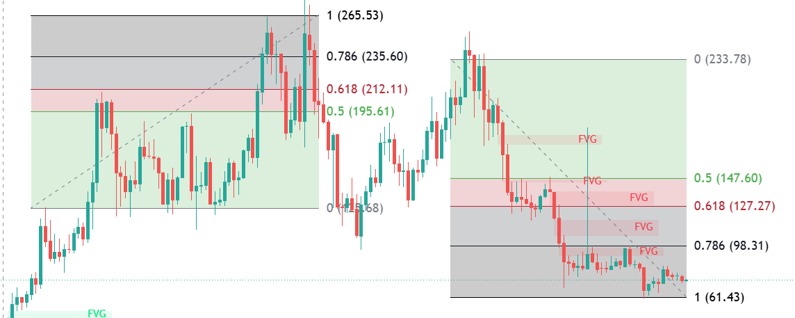
Fibonacci Retracement is a popular technical analysis tool used to identify potential support and resistance levels where the price may temporarily reverse or continue its trend. It helps traders determine likely pullback zones before the market resumes its primary direction.
The tool is drawn by connecting a significant swing low to a swing high in an uptrend, or a swing high to a swing low in a downtrend. It then plots key Fibonacci retracement levels where the price may reverse or continue its trend.
Common Fibonacci Levels;
- 6% – Shallow pullback
- 2% – Moderate pullback
- 0% – Psychological retracement level (not an official Fibonacci ratio but widely used)
- 8% – The “Golden Ratio,” considered one of the strongest reversal zones
- 6% – Deep pullback before a possible trend continuation
How Traders Use Fibonacci Retracement;
- Identify high-probability support and resistance levels.
- Find potential entry and exit points during a pullback.
- Set stop-loss and take-profit levels.
- Confirm trade setups when Fibonacci levels align with other technical tools.
Fibonacci with Candlestick Patterns: Fibonacci Retracement becomes more reliable when combined with price action. Traders often look for bullish or bearish candlestick patterns at key Fibonacci levels, such as:
- Pin Bar – Signals rejection of a key price level.
- Inside Bar – Indicates market consolidation before a possible breakout.
- Engulfing Bar – Suggests a strong reversal in market sentiment.
When these candlestick patterns form near important Fibonacci retracement levels, especially the 38.2%, 50%, or 61.8% levels, they can provide stronger confirmation of a potential buying or selling opportunity.
9. Volume indicators
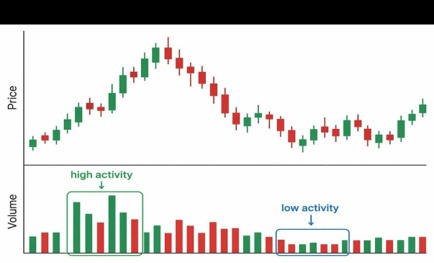
The Volume Indicator measures the number of assets such as shares, contracts, or coins traded during a specific period. It helps traders determine the strength and reliability of a price movement.
- High Volume: Indicates strong buying or selling interest, confirming the strength of a trend or breakout.
- Low Volume: Indicates weak market participation, suggesting that the current price movement may lack strength and could reverse.
Volume is commonly used to confirm trend direction, breakouts, reversals, and the strength of market momentum. It is most effective when combined with indicators such as Moving Averages, RSI, MACD, and Support & Resistance.
10. Stochastic Oscillator:
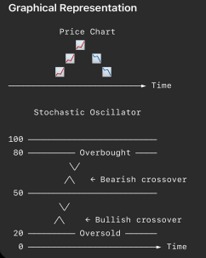
The Stochastic Oscillator is a momentum indicator that measures the position of an asset’s closing price relative to its price range over a specific period. It helps traders identify overbought and oversold market conditions, as well as potential trend reversals.
The Stochastic Oscillator is most effective when used alongside support and resistance, trend lines, RSI, MACD, and candlestick patterns to confirm trading signals.
11. Average Directional Index (ADX):
The ADX is a trend strength indicator developed by J. Welles Wilder Jr. It measures the strength of a market trend, regardless of whether the trend is moving upward or downward.
Unlike many indicators, the ADX does not indicate the direction of the trend. Instead, it tells traders whether the current trend is strong or weak. It is most effective when combined with indicators such as Moving Averages, RSI, MACD, Support & Resistance, and Candlestick Patterns to improve trading decisions.
Conclusion
Technical indicators should not be viewed as standalone trading systems but as complementary tools that collectively improve market analysis. Professional traders rarely rely on a single indicator. Instead, they combine price action, trend analysis, momentum indicators, volatility measures, volume analysis, and disciplined risk management to build higher-confidence trading strategies.
Ultimately, successful trading depends less on finding the “perfect” indicator and more on consistently applying a well-tested strategy while maintaining sound risk management and emotional discipline.